Graphing Google
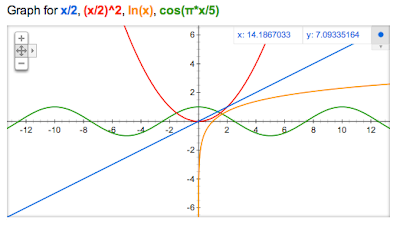
Now you can plot mathematical functions right on the search result page. Just type in a function and you’ll see an interactive graph on the top of the search results page.
Now you can plot mathematical functions right on the search result page. Just type in a function and you’ll see an interactive graph on the top of the search results page.
(This was written as a handout to accompany the IWB Training Session I took part in, I’ve posted it here as I hope it is of use to others! It is by no means a comprehensive list, my aim was to give staff a few pointers as to where they could start looking to integrate…
I’ve finally got round to changing my 3 default passwords using this method. I have 1 for banking. 1 for my main social media and blogging accounts and then 1 for all the other sites I subscribe to.
Schools across the UK are currently getting to grips with the new performance management framework that is being introduced nationwide this school year. I’m a ‘Main Scale’ teacher at the moment, and one of the benefits of the new system appears to be how ‘Threshold’ will be tackled. Previously you had to apply to pass…
Not all online learning networks actually thrive, here’s a tale of a failed attempt by myself: Ghost Town I have been involved with a couple of projects in Manchester as part of a collaborative of schools from across the city. Part of this was the continuation of the LEMA project and the creation of some…
I attended Alan O’Donohoe’s excellent Hack To The Future event at Our Lady’s High School in Preston on Saturday with 13 of our students, many of whom are on our GCSE Computing course. There were many highlights, in particular I should mention Freaky Clown and his tales of a hacker turned good. I won’t repeat…
Originally posted as a LinkedIn article, this looks at the publication of the 2022 Secondary accountability measures. The first such results published for 3 years.